


In a recent study published by the Office for National Statistics (ONS), figures show the changing nature of workless households. The statistics come from the Annual Population Survey (APS) and cover the period of January to December 2016, and only include households where at least one person is aged 16 to 64 years old. Workless households are defined by the ONS as “families that contain at least one person aged 16-64 and where no one aged 16 or over is in employment due to unemployment, or being economically inactive”. Economically inactive can be for a number of reasons, such as family commitments, retirement and study, or through sickness or disability”.
Those living in the areas with the highest and lowest percentages of workless families in 2016 had similar rankings in previous years too. Accumulating all years from 2006 to 2016, Glasgow City and Liverpool were consistently among the top 10 counties for the highest number of workless households in the UK. In contrast, West Berkshire was among the bottom 10 during this period.
Average rank of counties with the highest percentage of workless households:
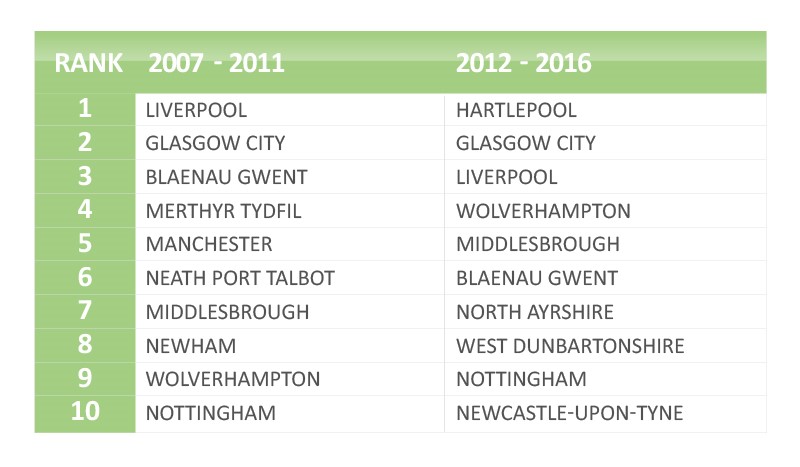
Source: ONS
During the five-year period of 2011 to 2016, more than four out of five (86.7%) counties saw an increase in the percentage of working households. According to YouGov, the number of households where no one works has fallen by 828,000 since 2010, and is now at its lowest level in more than a decade. Statistics show that over 17.6 million households have at least one working adult and less than 15% of households are classed as ‘workless’. This is most likely due to the declining unemployment rate in the UK, which currently stands at 4.5% – the lowest level since the summer of 1975. Since the beginning of the year, there have been considerably more vacancies on offer across the country than ever before, with 777,000 jobs advertised from February to April 2017 according to the Telegraph, indicating companies want to hire more staff in the months ahead.
In addition, rising rents and living costs have resulted in many choosing to stay at work for longer, especially in the city. London, in particular, had the notably lowest percentage of people aged 16 to 64 years who were in workless households due to early retirement. However, on the other end of the scale, the East of England and the South of England had the highest percentage at 24.9% and 23.3% respectively.
The counties with the highest percentage of workless households between 2011 and 2016 tended to be located outside the south of England, including London, South East, South West and the East of England. However, not all counties located outside the South of England had high percentages of workless households. Only eight of the 50 areas with the lowest number of workless households in 2016 were in Scotland, Wales, the Midlands and the north of England. Counties such as Hartlepool, North Ayrshire and Inverclyde were placed at the top with the highest percentage of workless households in 2015 and 2016.
On the other hand, the top 15 areas with the lowest percentage of workless households were located in the south of England. Among these were Windsor and Maidenhead and Bracknell Forest, which were in the top five areas with the lowest percentage of workless households in both 2015 and 2016.
Average rank of counties with the lowest percentage of workless households:
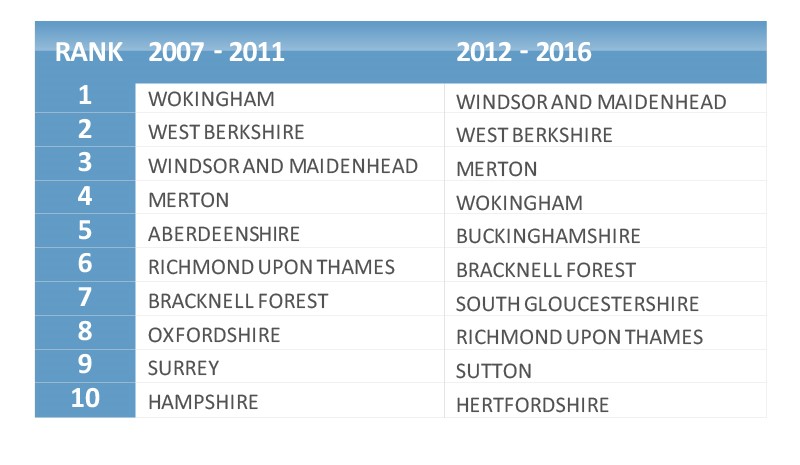 Source: ONS
From this research by the ONS, the data excludes households where all members are in education and what is known as ‘student houses’ or halls. However, it is interesting to see that figures show that most of the counties with the highest and lowest percentages of workless households in 2016 were the same as those when student households were included. In particular, four of the top five and all of the bottom five local regions remained the same when student households were excluded. In most counties, the percentage of workless non-student households was slightly lower than the percentage of all households combined, reflecting the greater likelihood that student households were workless.
Feature image credit: Tero Vesalainen / Shutterstock