


The average house price in England and Wales stands at £186,553, with an annual price change of 5.3 per cent as shown by data collected in September. House prices have increased only slightly by 1 per cent on a monthly basis and the number of property transactions has also decreased over the last year. Statistics have shown that from April 2014 to July 2014, there was on average 78,330 sales per month compared to 71,766 in the same months a year later. The areas that have typically had low transaction volumes include: City of London, Isle of Anglesey, Rutland, Merthyr Tydfil, Blaenau Gwent, Ceredigion and Torfaen. ONS September house price statistics have shown dramatic changes to the property market industry and results are below.
ONS September house price statistics
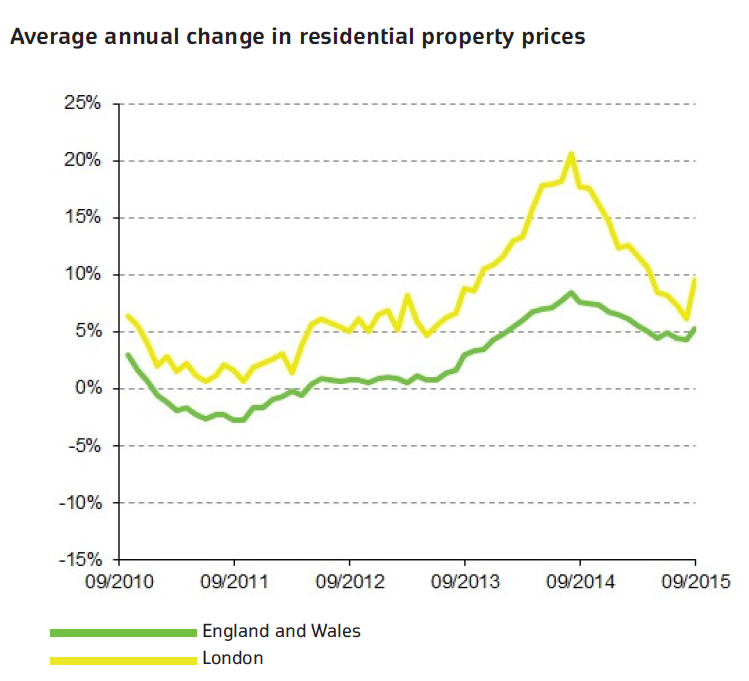
Residential property prices in London have seen a continuous increase, making it very difficult to afford a home in the capital. Research shows that the average price of property in London is £499,997 in comparison to the average for England and Wales which is £186,553. London had shown a monthly increase of 1.8 per cent. London has a considerably higher annual change of 9.6 per cent. To put it into perspective, average prices per property type for England and Wales are a lot less than London. For a detached house, there was a 5.4 per cent increase, bringing average prices for September 2015 to £291,836. Terraced houses were the cheapest on average but with an increase of 5.2 per cent. For an average terraced house in England wales, you would expect to pay £140,773 this year.
The Land Registry House Price Index analysed price changes across every region of England and Wales. London, understandably had the largest movement and the North East saw a notable decrease of 0.3 per cent in one year. Significantly, the monthly price also fell by 0.3 per cent; the only decrease in the country. The South East, is not too far behind London, in that the monthly change in house prices saw an increase of 0.7 per cent and an annual change of 8.5 per cent. An average property in the South East costs £256,737, with the North East on average costing £99,559.
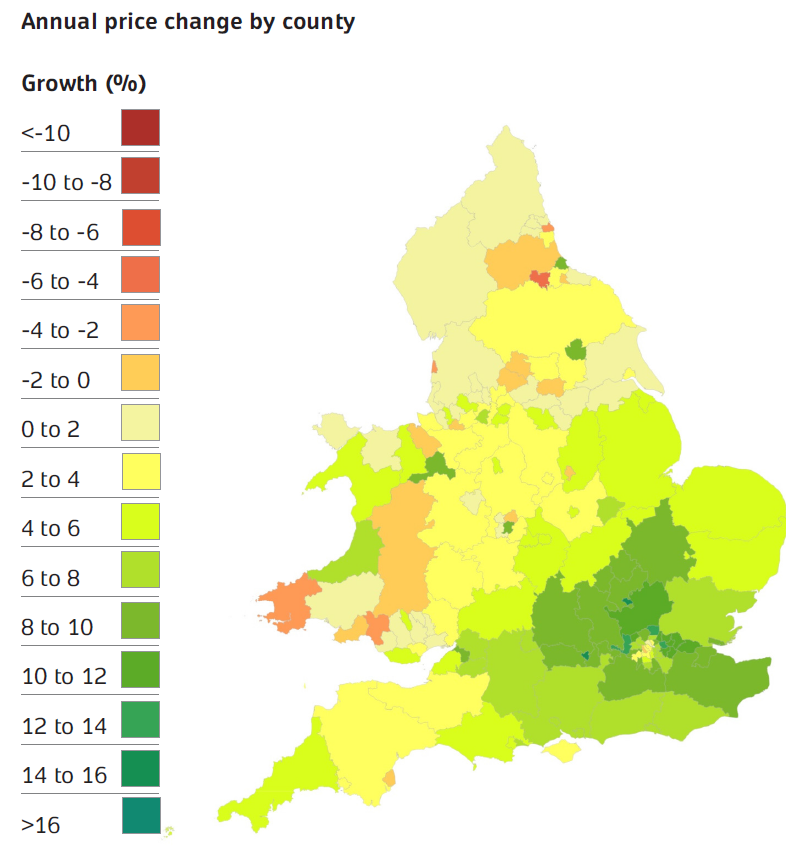
Not only were regions analysed, but each county was assessed according to price changes in the past year. Reading had the greatest annual price increase in September with a movement of 15.3 per cent and average house prices in the area of £257,842. It was the largest increase across counties in the UK and Darlington had the most dramatic and significant price fall of -5.1 per cent. Merthyr Tydfil did not fall too far behind Darlington, with a monthly price fall of -3.3 per cent. Newport had a strong monthly growth of 2.2 per cent and an annual change of 0.4 per cent, bringing the average property price up to £114,343.
ONS September house prices statistics
In contrast, the House Price Index examined price change according to a metropolitan district of the country. From Birmingham to Manchester and Liverpool, the housing market was analysed, highlighting Sandwell to have had the largest annual price increase by 9.1 per cent. Significantly, Sandwell did experience a slight decrease in monthly price changes of -0.1 per cent. Knowsley had the highest monthly percentage change of 2.5 per cent, compared to South Tyneside and Sefton, with a monthly decrease of -1.3 per cent.
Not only are regions, counties and cities analysed according to monthly and annual property price changes, boroughs are integral to understanding how the property market shifts in certain areas. Kensington and Chelsea is an incredibly expensive area for properties, with average property prices around £1,342,794; with Westminster following in second place with average property prices at £1,003,055. However, despite these areas an extremely expensive hub of the capital, they did not experience a significant price change. Newham had the largest annual price rise of 13.6 per cent, with a monthly price change of 0.5 per cent. The borough with the highest monthly price change was Hounslow of 2.1 per cent. Hackney was the only borough to have seen a monthly decrease of -0.3 per cent, with an annual growth of 8.5 per cent. Average property prices in Hackney were relatively expensive; £629,821.
Feature image credit: Tanoy1412/Shutterstock